Introduction
In today’s digital era, the awareness of data privacy has significantly heightened. Users increasingly recognize their data as a unique digital fingerprint, posing a risk to their privacy in the event of data breaches. This concern is further amplified by regulations like GDPR, which empower users to request the deletion of their data. While much needed, this legislation can be very costly for companies as access to data is minimized; This not only adds to the complexities of training a model but is also very time- and resource-consuming.
Enter synthetic data, a promising solution to this conundrum. Synthetic data generators create datasets that mimic real user data while preserving anonymity and confidentiality. This approach is gaining traction across industries, from healthcare to finance, where privacy is paramount.
This post is tailored for data professionals and enthusiasts, focusing on the evaluation of synthetic data generators. We will delve into key metrics and conduct a comparative analysis between Syntho’s Engine and its open-source alternatives, offering insights on how to effectively assess the quality of synthetic data solutions. Furthermore, we will also evaluate the time cost of each of these models to provide further insight into the working of the models.
What follows is a rigorous comparative analysis of the Syntho Engine alongside a well-known open-source framework, the Synthetic Data Vault (SDV). In this analysis, we used many commonly used metrics such as statistical fidelity, predictive accuracy, inter-variable relationship, and distributional divergence metrics.
Synthetic Data Evaluation Metrics
Before introducing any specific metric, we must acknowledge that there are numerous ideologies about evaluating Synthetic data, each of which gives insight into a certain aspect of data. With this in mind, the following four categories stand out as being the most important and comprehensive. These metrics provide insights into various aspects of data quality. These categories are:
- Statistical Fidelity Metrics: Examining basic statistical features of the data, like means and variances, to ensure the synthetic data aligns with the original dataset’s statistical profile.
- Predictive Accuracy: Examining model performance, trained with original data, and evaluated on synthetic data (Train Real – Test Synthetic, TRTS) and vice versa (Train Synthetic – Test Real, TSTR)
- Inter-Variable Relationships: This combined category includes:
- Feature Correlation: We assess how well the synthetic data maintains the relationships between variables using correlation coefficients. A well-known metric like the Propensity Mean Squared Error (PMSE) would be of this type.
- Mutual Information: We measure the mutual dependences between variables to understand the depth of these relationships beyond just correlations.
- Distributional Divergence Metrics: Assessing the resemblance of data distributions between synthetic and original datasets (with metrics such as Earth Mover’s Distance (EMD), Kullback-Leibler-Divergence and Jensen-Shannon-Divergence)
Comparative Analysis: Syntho Engine vs. Open-Source Alternatives
The comparative analysis was conducted using a standardized evaluative framework and identical testing techniques across all models, including Syntho Engine and SDV models. By synthesizing datasets from identical sources and subjecting them to the same statistical tests and machine learning model assessments, we ensure a fair and unbiased comparison.
The section that follows details the performance of each synthetic data generator across a wide range of metrics presented above. Given that some of these representations are visual and therefore prone to simplification, we have also provided a link to our result-replication-framework which you can use to reproduce the results that we have here.
As for the dataset used for the evaluation, we used the UCI Adult’s Census Dataset which is a well-known dataset in the machine learning community. We cleaned the data prior to all training and then split the dataset into two sets (a training and a holdout set for testing). We used the training set to generate 1 million new datapoints with each of the models and evaluated various metrics on these generated datasets. For further machine learning evaluations, we used the holdout set to evaluate metrics such as those related to TSTR and TRTS.
Each generator was run with default parameters. As some of the models, like Syntho, can work out-of-the-box on any tabular data, no fine tuning was done. Searching for the right hyperparameters for each model would take a significant amount of time, and Table 2 already shows a large time difference between Syntho’s model and the ones tested against.
It is noteworthy that as opposed to the rest of the models in SDV, the Gaussian Copula Synthesizer is based on statistical methods. In contrast, the rest are based on neural networks such as generative models and variational auto-encoders. This is why Gaussian Copula can be seen as a baseline for all the models discussed.
Results
Data Quality
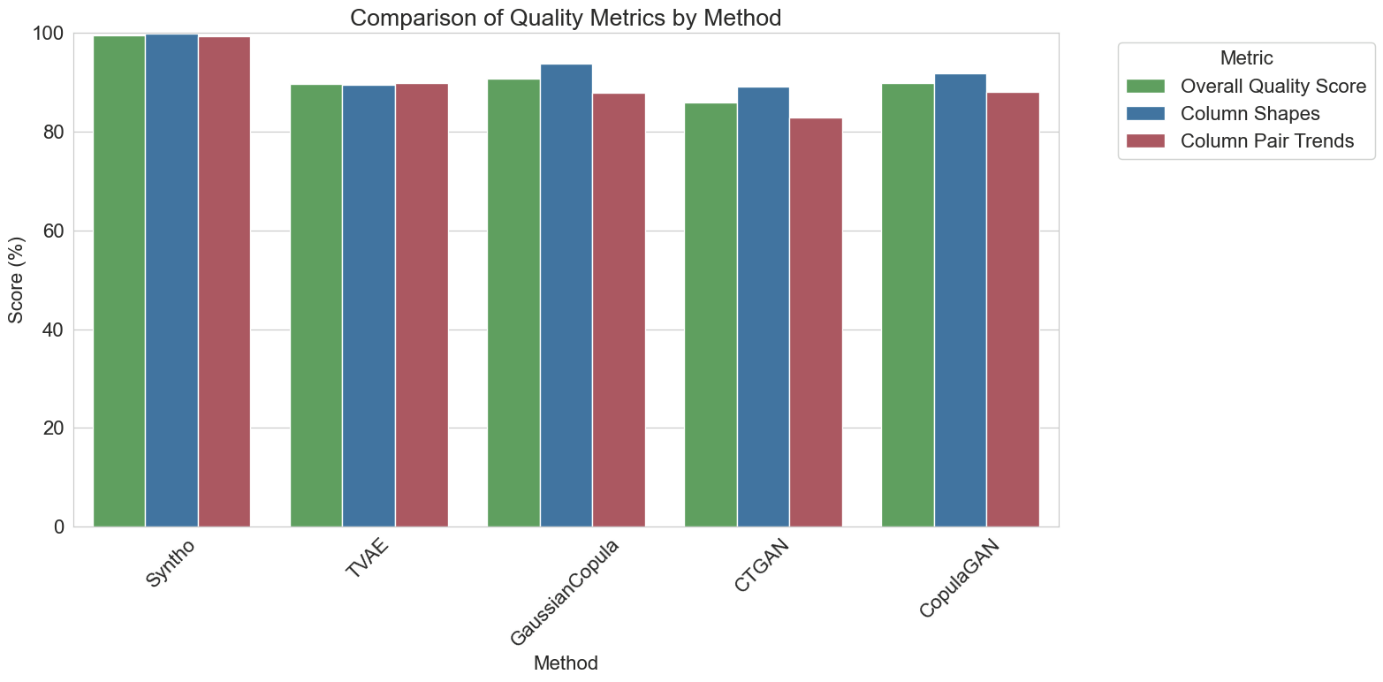
Figure 1 visualization of basic quality results for all models
The previously discussed adherences to trends and representations in the data can be found in Figure 1 and Table 1. Here, each of the metrics in use can be interpreted as follows:
- Overall Quality Score: Overall assessment of synthetic data’s quality, combining various aspects like statistical similarity and data characteristics.
- Column Shapes: Assesses whether the synthetic data maintains the same distribution shape as the real data for each column.
- Column Pair Trends: Evaluates relationship or correlations between pairs of columns in synthetic data compared to real data.
Overall, it can be noticed that Syntho achieves very high scores across the board. To begin with, when looking at overall data quality (evaluated with the SDV metrics library) Syntho can achieve a result upwards of 99% (with column shape adherence of 99.92% and column pair shape adherence of 99.31%). This is whilst SDV gets a result of maximally 90.84% (with Gaussian Copula, having a column shape adherence of 93.82% and column pair shape adherence of 87.86%).
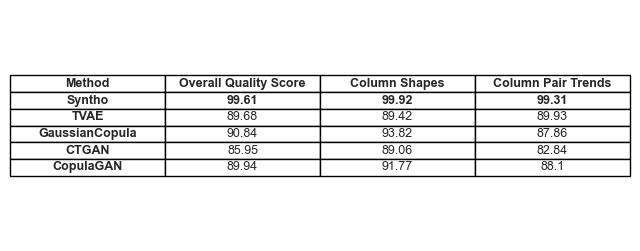
Table 1 A tabular representation of the quality scores of each generated dataset per model
Data Coverage
The Diagnosis Report module of SDV brings to our attention that SDV-generated data (in all cases) is missing more than 10% of the numeric ranges; In the case of Triplet-Based Variational Autoencoder (TVAE), the same amount of categorical data are also missing when compared to the original dataset. No such warnings were generated with the results achieved by using Syntho.
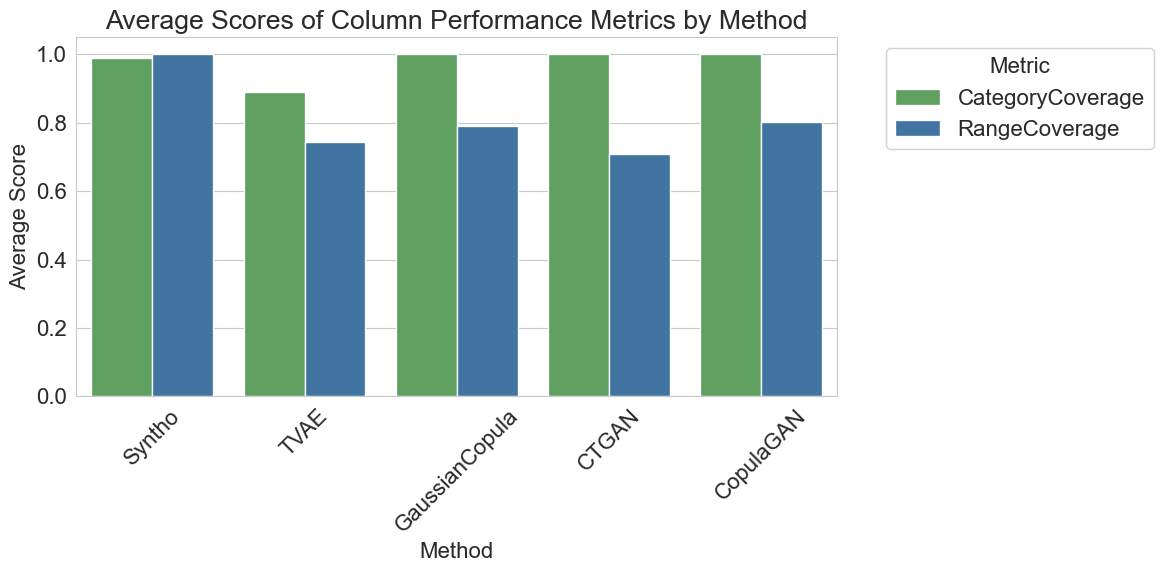
Figure 2 visualization of average column-wise performance metrics for all models
In the comparative analysis, the plot of Figure 2 illustrates that SDV archives marginally better results in category coverage with some of their models (namely with GaussianCopula, CopulaGAN, and Conditional Tabular GAN – CTGAN). Nevertheless, it is important to highlight that the reliability of Syntho’s data surpasses that of SDV models, as the discrepancy in coverage across categories and ranges is minimal, exhibiting a mere 1.1% variance. In contrast, SDV models demonstrate a considerable variation, ranging from 14.6% to 29.2%.
The represented metrics here, can be interpreted as follows:
- Category Coverage: Measures the presence of all categories in synthetic data as compared to real data.
- Range Coverage: Evaluates how well the range of values in synthetic data matches that in real data.
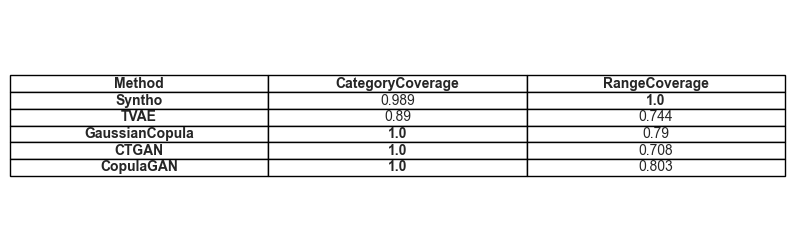
Table 2 A tabular representation of the average coverage of a given attribute type per model
Utility
Moving on to the topic of utility of synthetic data, the matter of training models on the data becomes relevant. To have a balanced and fair comparison between all frameworks we have chosen the default Gradient Boosting Classifier from the SciKit Learn library, seeing it is fairly accepted as a well-performing model with out-of-the-box settings.
Two different models are trained, one on the synthetic data (for TSTR) and one on the original data (for TRTS). The model trained on the synthetic data is evaluated by using a holdout test set (which was not used during data generation) and the model trained on original data is tested on the synthetic dataset.
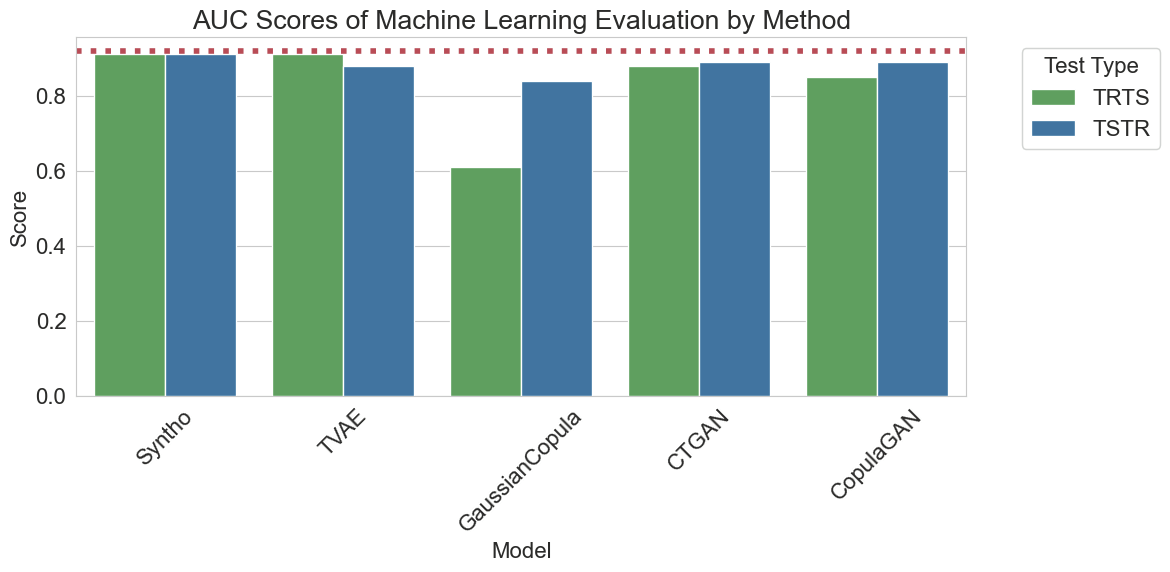
Figure 3 visualization of Area Under the Curve (AUC) scores per method per model
The results visualized above demonstrate the superiority of Synthetic data generated by the Syntho engine as compared to other methods, seeing there is no difference between the results obtained by the different methods (pointing towards a high similarity between the synthetic and real data). Also, the red dotted line present in the plot is the result obtained by evaluating the base performance of a Train Real, Test Real (TRTR) test to provide a baseline for the observed metrics. This line represents the value 0.92, which is the Area Under the Curve score (AUC score) achieved by the model trained on real data and tested on real data.
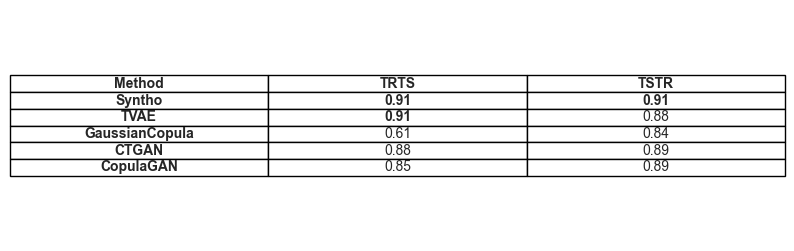
Table 3 A tabular representation of the AUC scores achieved by TRTS and TSTR respectively per model.
Distributional Divergence
Finally, when we delve into more advanced metrics like Earth Mover’s Distance, also known as Wasserstein distance, the consistent trend of superiority stands out. The aim is to minimize this metric, and the notable difference in Earth Mover’s distance, spanning from 1.0434 to 687.4644, clearly demonstrates that the synthetic data produced by Syntho closely mirrors the original distributions in the data.
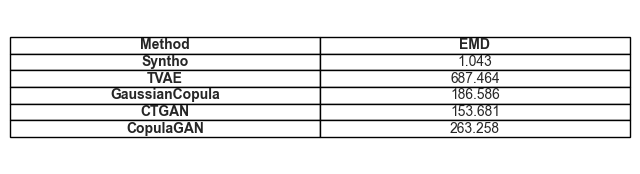
Table 4 A tabular representation of the EMD scores associated with each synthetic dataset per model.
Time-wise comparison
Naturally, it is crucial to consider the time invested in generating these results. The visualization below illustrates just this.
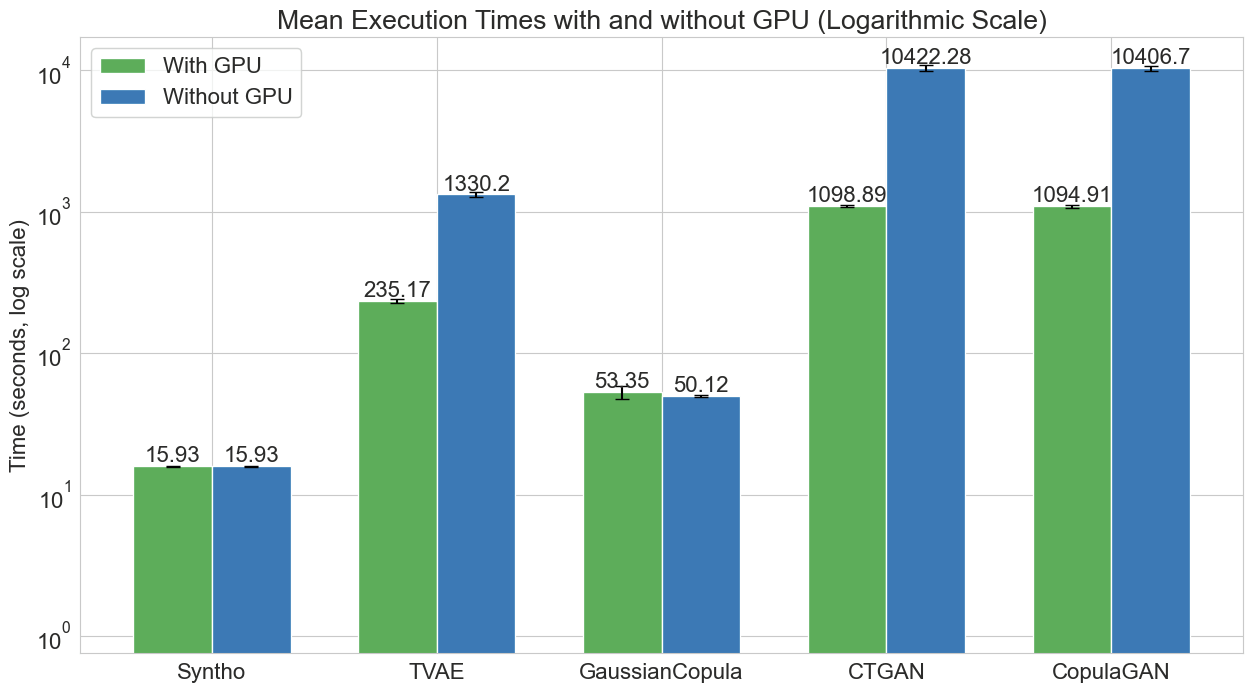
Figure 5 visualization of the time taken to train and generator one million datapoints with a model with and without a GPU.
Figure 5 illustrates the time taken to generate data in two different settings. The first of which (here referred to as Without GPU), were test runs run on system with an Intel Xeon CPU with 16 cores running at 2.20 GHz. The tests marked as “ran with a GPU” were on a system with an AMD Ryzen 9 7945HX CPU with 16 cores running at 2.5GHz and a NVIDIA GeForce RTX 4070 Laptop GPU. As noticeable in Figure 2 and in Table 2 below, it can be observed that Syntho is significantly faster at generating synthetic data (in both scenarios) which is critical in a dynamic workflow.
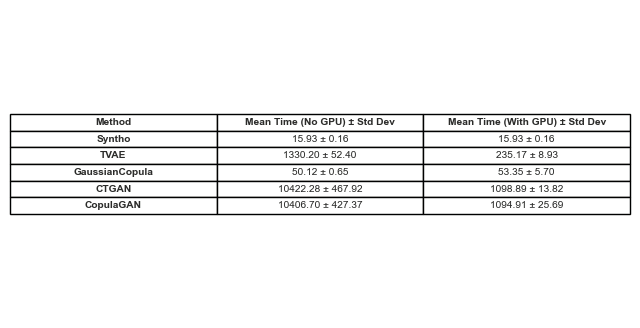
Table 5 A Tabular representation of the time taken to generate one million datapoints with each model with and without a GPU
Concluding Remarks and Future Directions
The findings underscore the importance of thorough quality evaluation in choosing the right synthetic data generator. Syntho’s Engine, with its AI-driven approach, demonstrates noteworthy strengths in certain metrics, while open-source tools like SDV shine in their versatility and community-driven improvements.
As the field of synthetic data continues to evolve, we encourage you to apply these metrics in your projects, explore their intricacies, and to share your experiences. Stay tuned for future posts where we will dive deeper into other metrics and highlight real-world examples of their application.
At the end of the day, for those looking to test the waters on synthetic data, the presented open-source alternative can be a justifiable choice given accessibility; however, for professionals incorporating this modern technology into their development process, any chance at improvement must be taken and all hinderances avoided. It is therefore important to choose the best option available. With the analyses provided above it becomes rather apparent that Syntho and with that the Syntho Engine is a very capable tool for practitioners.
Call to Action
Interested in what synthetic can mean for your company? book an online demo and explore how YOU can make some real impact using Synthetic data.